Building an AI-Ready Azure Security Lab with Ansible and Docker
How I extended an Azure Ubuntu DevOps lab with two Docker services, an Nginx reverse proxy, Ansible health checks, and a Python SSH log detector using reproducible test evidence.
Can a small Azure Ubuntu VM run a reproducible application stack and produce useful security detection evidence without exposing the application to the public internet? I extended my existing Terraform and Docker lab to answer that question.
This follow-up adds Apache Tomcat with a Java/JSP application, Nginx reverse proxying, Ansible deployment checks, and a lightweight Python SSH log monitor. I validated each stage on the running VM, captured terminal screenshots, and deallocated the VM after testing.
The work is a hands-on demonstration, not a production security system. Wazuh ingestion and local Qwen analysis are planned integrations, not completed parts of this Azure iteration. My separate Wazuh and local Qwen lab covers the existing AI-assisted SOC proof of concept.
Environment and boundaries
The extension reused an Azure Ubuntu 24.04.5 LTS virtual machine with 2 vCPU, 8 GB RAM, Docker Engine, and Docker Compose in North Central US. Administrative SSH access used an SSH key and a temporary Azure NSG rule restricted to a single source IPv4 address. That temporary rule was removed when testing finished.
Two services ran in different Docker Compose projects:
| Service | Container | VM listener | Purpose |
|---|---|---|---|
| Nginx | devops-nginx |
127.0.0.1:8080 |
Static page and reverse proxy |
| Tomcat 10.1 / Java 21 | devops-tomcat |
127.0.0.1:8081 |
Small JSP application |
Both published ports were bound to loopback inside the VM. No inbound HTTP port was opened in the Azure NSG. The Java app was tested locally through curl and the private Docker network.
1. Verify a real Java application in Tomcat
I launched tomcat:10.1-jre21-temurin with Docker Compose and mounted a small JSP test application into its ROOT webapp. The JSP rendered a timestamp using java.time.Instant.now().
The initial container status showed devops-tomcat running with 127.0.0.1:8081->8080/tcp. The HTTP response was 200 OK and included a generated timestamp, providing evidence that the JSP expression executed server-side rather than serving only a static page.
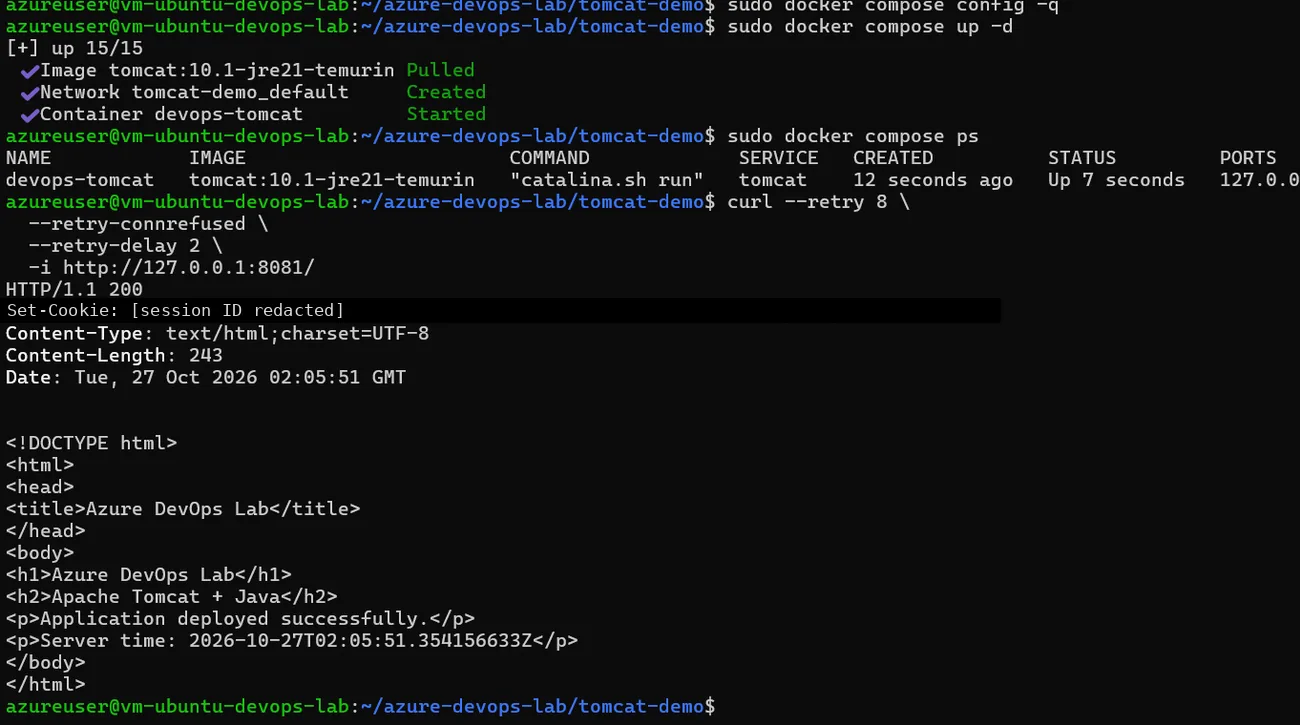
Figure 1. Docker Compose started the Tomcat service and curl received HTML containing a runtime-generated Java timestamp.
2. Connect Nginx to Tomcat over a private Docker network
Initially, each Compose project had its own default network. The containers were healthy but not yet on the same user-defined network. I created ai-lab-backend, connected both containers, then recorded the network in each project’s Compose override file so future recreations would preserve it.
A direct connectivity test from inside the Nginx container succeeded:
sudo docker exec devops-nginx \
  wget -qO- http://devops-tomcat:8080/
The response included the Java application’s HTML. That tested name resolution and service-to-service communication; it was not yet proof of reverse proxy routing.
Next, I configured Nginx to keep serving its static / route while forwarding /app/ to Tomcat:
location = /app {
    return 301 /app/;
}

location /app/ {
    proxy_pass http://devops-tomcat:8080/;
    proxy_http_version 1.1;
    proxy_set_header Host $host;
    proxy_set_header X-Real-IP $remote_addr;
    proxy_set_header X-Forwarded-For $proxy_add_x_forwarded_for;
    proxy_set_header X-Forwarded-Proto $scheme;
}
I validated the Compose configurations, reapplied the services and checked both endpoints independently:
curl -I http://127.0.0.1:8080/
curl -i http://127.0.0.1:8080/app/
Both returned HTTP 200. The proxied /app/ response included the JSP-generated server time and a response header identifying Nginx. This confirmed the path:
Local HTTP client -> Nginx :8080 -> ai-lab-backend
                  -> Tomcat :8080 -> JSP / Java 21
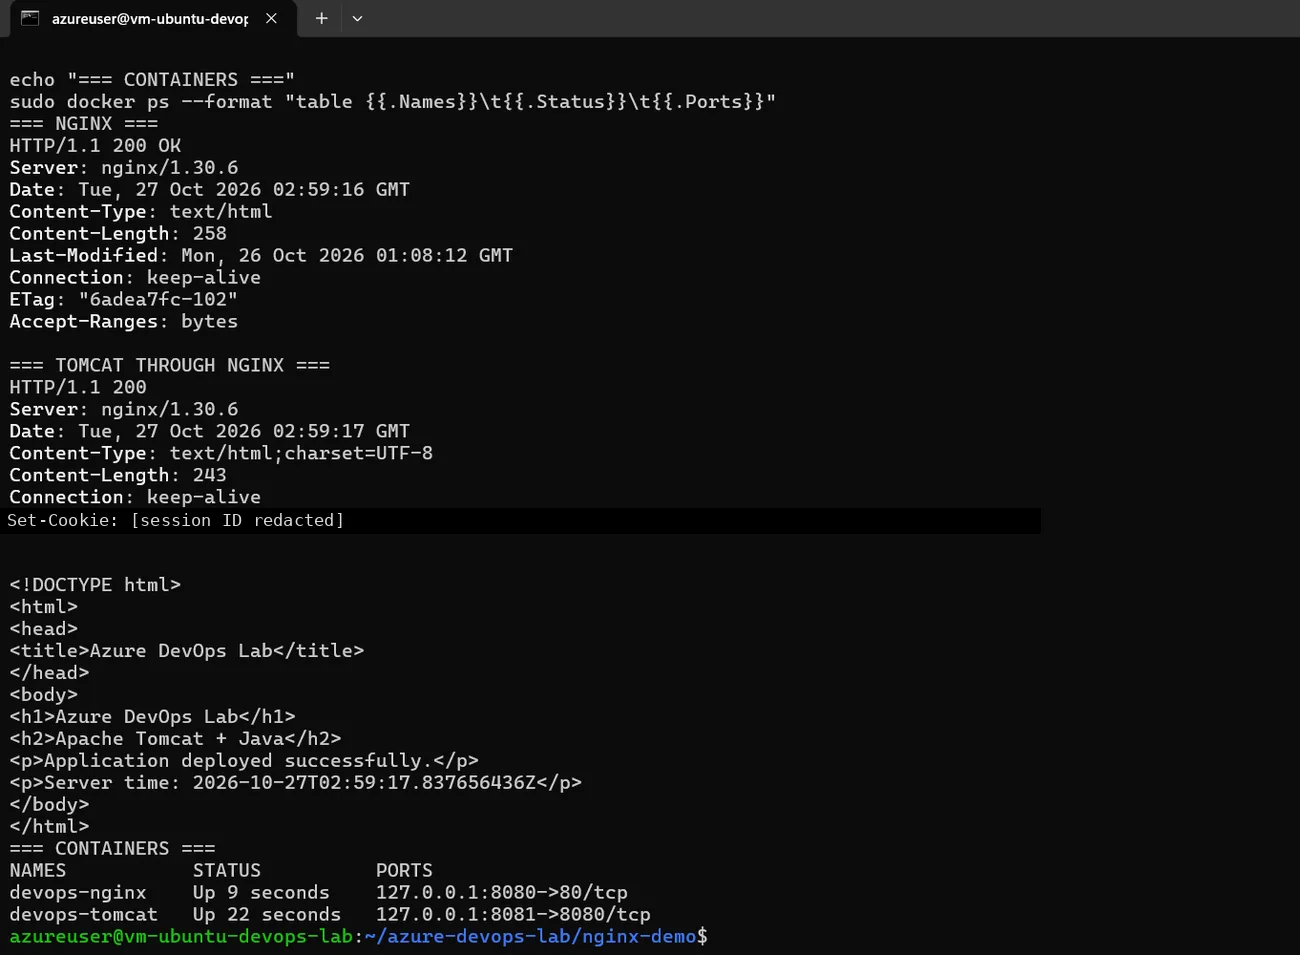
Figure 2. Nginx serves / and forwards /app/ to Tomcat. Both checks returned HTTP 200 without opening a public web port.
3. Use Ansible to verify the full application stack
A working manual deployment is a useful starting point, but I wanted the verification process to be repeatable. I installed ansible-core and confirmed the local connection with ansible localhost -i 'localhost,' -c local -m ping (pong).
The stack.yml playbook then performed these checks:
- Inspect the shared Docker network.
- Validate both Docker Compose configurations.
- Ensure Tomcat and Nginx are running.
- Run
nginx -tinside the Nginx container. - Request both the static Nginx page and the proxied Java application.
- Assert the expected Java application text is present.
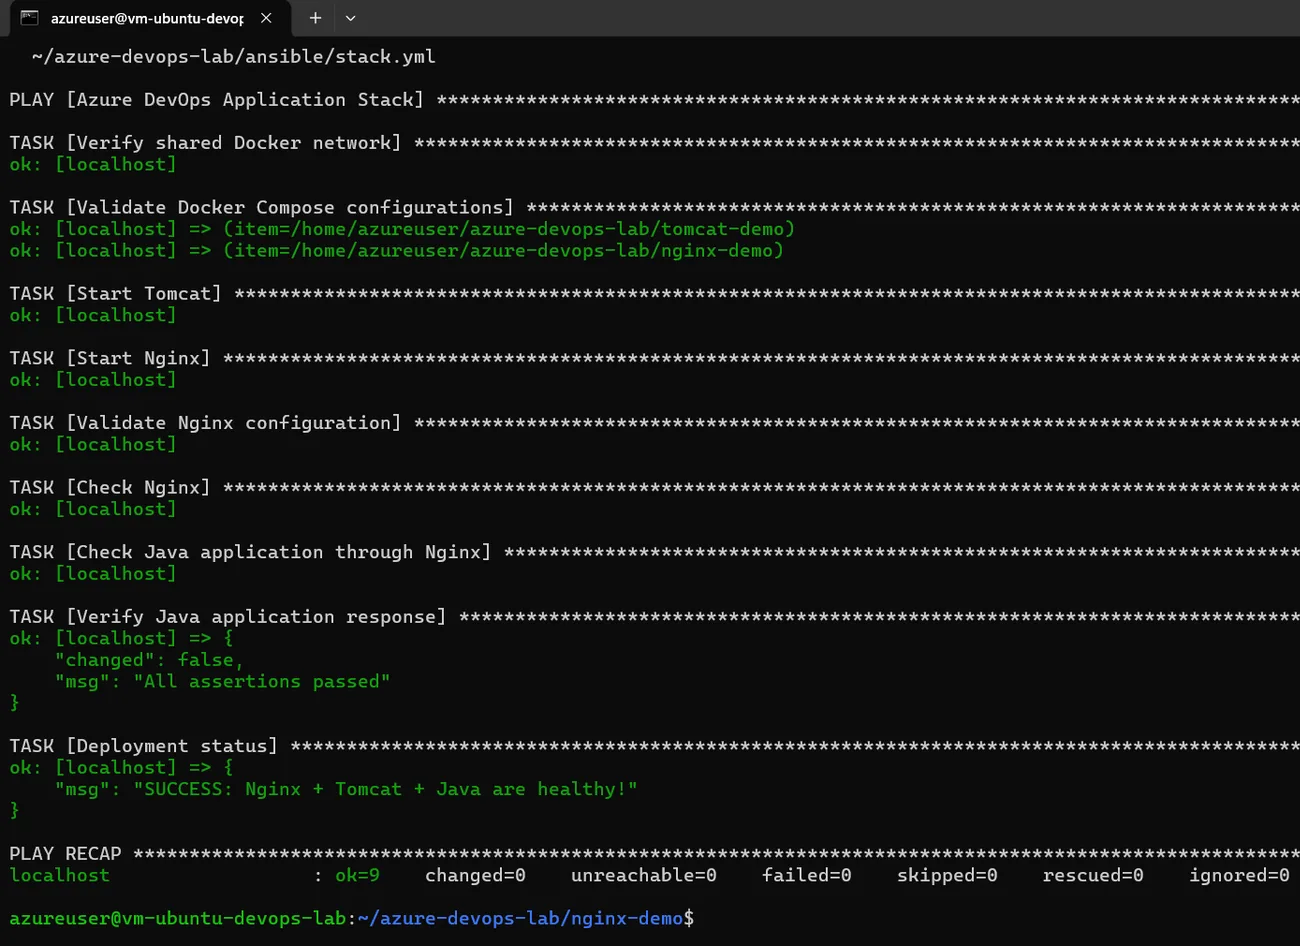
The resulting execution summary was:
PLAY RECAP
localhost : ok=9 changed=0 unreachable=0 failed=0
SUCCESS: Nginx + Tomcat + Java are healthy!
Figure 3. The full-stack playbook passed all nine checks against an already healthy deployment.
Important limitation: some tasks currently call docker compose through ansible.builtin.command and infer changes from Compose output. The zero-change result shows this run did not report modifications; it does not establish full idempotency for every future failure or update. I plan to improve change reporting and converge toward maintained Ansible Docker modules.
4. Transform SSH journals into structured security alerts
With the application deployment verified, I added a small Python detector. It reads SSH service journal text from standard input, recognizes selected messages (Accepted publickey, Accepted password, Failed password, Invalid user), and produces a JSON summary.
A read-only 24-hour check showed seven SSH journal lines, including one recognized successful login and zero matching failed attempts. This was a narrow log-pattern check, not a security clearance or proof that the host had experienced no blocked connection attempts.
The monitoring pipeline was straightforward:
sudo journalctl -u ssh.service \
  --since '24 hours ago' --no-pager -o cat \
  | python3 ssh_monitor.py
The script groups failed-login log records by source IP and emits a medium-severity lab alert when a source reaches three matching records. It does not yet deduplicate log messages or correlate events within an explicit time window.
To test the detection path safely, I supplied three synthetic failed SSH password messages from 203.0.113.42, an address reserved for documentation examples. No live brute-force traffic was sent to the VM.
The resulting JSON contained:
{
  "total_matched_events": 3,
  "event_counts": { "ssh_login_failed": 3 },
  "alerts": [
    {
      "rule": "SSH_MULTIPLE_FAILURE_LOGS",
      "source_ip": "203.0.113.42",
      "count": 3,
      "severity": "medium"
    }
  ]
}
The actual report also included generated_at and source fields. I saved both the test fixture and JSON result so the detection check can be repeated.
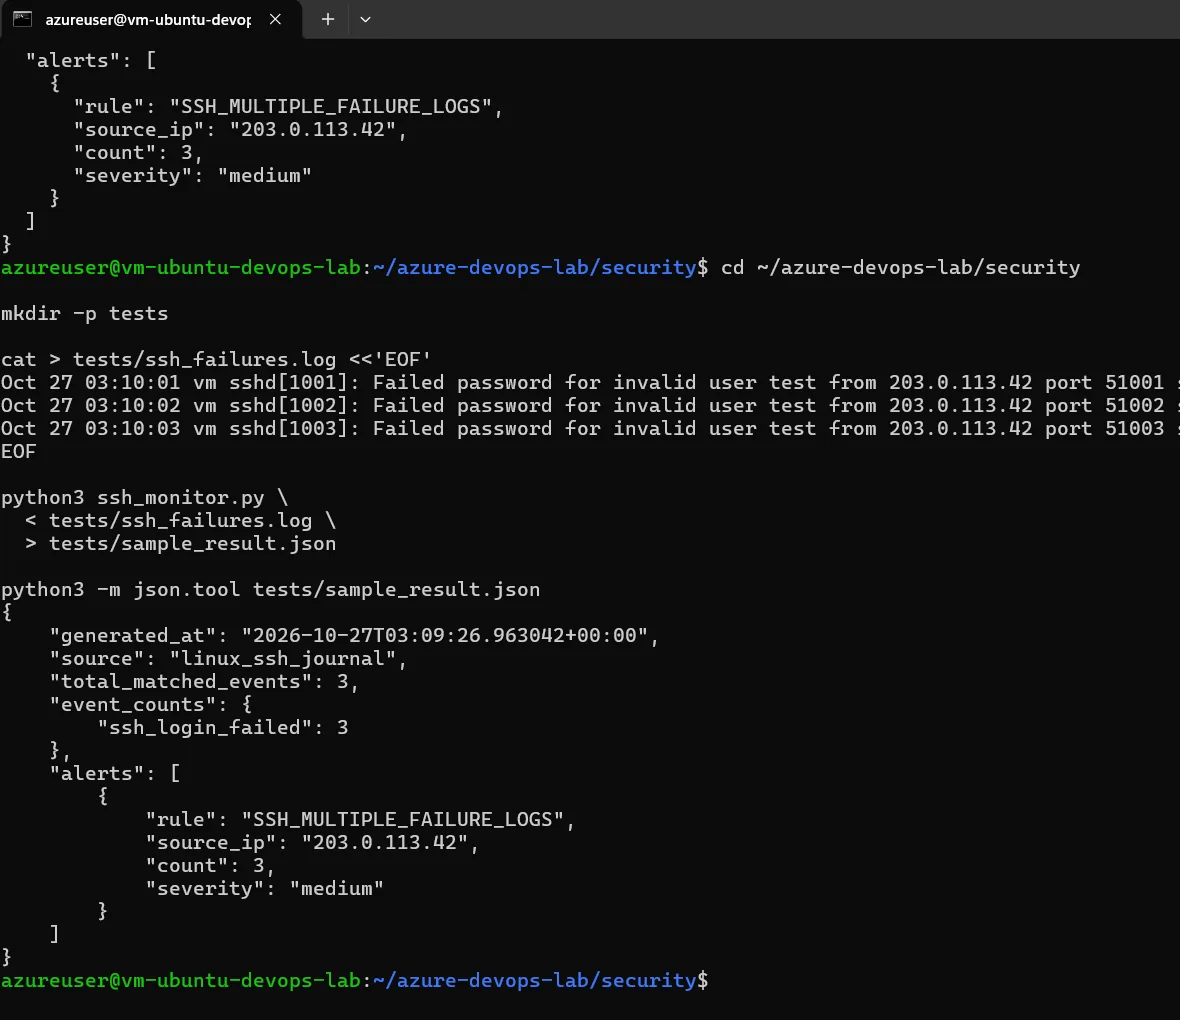
Figure 4. A controlled fixture produced one structured alert. The IP address is synthetic and does not identify a real attacker.
5. What this exercise proves—and what it does not
Verified on the Azure VM:
- Nginx and Tomcat were healthy in separate Compose projects and could communicate over a shared user-defined Docker network.
- Nginx reverse-proxied
/app/to a Java/JSP application; both Nginx and the proxied route returned HTTP 200. - Ansible completed nine checks with zero failures.
- Python parsed real SSH journal input and produced a JSON report.
- Three synthetic failed-login records triggered a single medium-severity lab alert.
- The VM was deallocated afterward and the temporary inbound SSH rule was deleted.
Not yet implemented or verified here: continuous ingestion, Wazuh agent integration with this Azure VM, hardened log correlation, production alerting, local Qwen analysis of these Azure events, automated remediation, or a public web deployment. These are future experiments, not completed capabilities.
6. How this becomes an AI-assisted SIEM detection lab
A recurring question is how to integrate AI into a cybersecurity SIEM detection lab. My answer starts with reliable log collection, deterministic rules, structured JSON, controlled test fixtures, and a human review boundary. Those safeguards come before prompting a language model. The next design iteration would make the security telemetry portable without needing a large language model or a full SIEM stack on the small Azure VM:
Azure Ubuntu SSH journal
        |
        v
Python event normalization + detection
        |
        v
Validated JSON events (no secrets)
        |
        v
Existing local Wazuh / OpenSearch lab
        |
        v
Local Qwen-assisted triage -> human review
I already built a separate Wazuh + Qwen SOC proof of concept. The planned work is to bridge these two labs, not to claim they were already connected. Any model-produced explanation will be treated as a hypothesis and verified against the actual log records.
Lessons learned
- Private networking is an architectural choice. Loopback-bound published ports and an internal Docker network made the application testable without a public web listener.
- Verification beats a green status label.
docker compose ps,nginx -t, a static HTTP check, and a Java response check tested different layers. - Automation needs accurate change reporting. A passing Ansible run is meaningful, but it is not a substitute for testing failure recovery.
- Security detection needs known-good fixtures. Synthetic SSH records made the alert logic repeatable without attacking a real service.
- Cloud cost controls belong in the runbook. Deallocation stops VM compute billing, while persistent resources such as disks and certain networking components can still incur charges.
This is the second part of my Azure infrastructure lab series. For deeper SIEM and LLM engineering details, see Building a Local AI SOC Lab with Wazuh and Qwen.
Environment: Azure North Central US · Ubuntu 24.04.5 LTS · Docker / Compose · Nginx · Apache Tomcat 10.1 · Java 21 · Ansible · Python. Verified during the October 26, 2026 session (Michigan local time).
November 2026 update: Azure → Wazuh monitoring completed
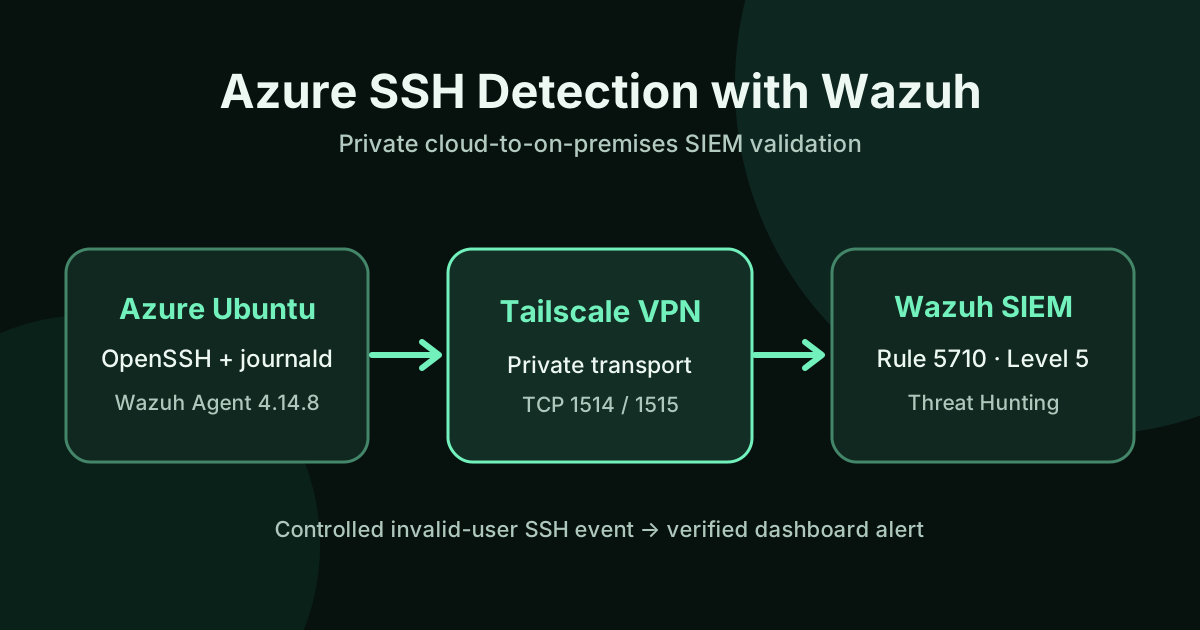
The Wazuh integration described above as future work was subsequently implemented and verified on November 7–8, 2026. A Wazuh 4.14.8 agent on the Azure VM sent SSH journald events to the on-premises Wazuh Manager across a private Tailscale network. A controlled invalid-user SSH test produced rule 5710 (level 5), confirmed in the Manager and Dashboard. Public SSH access was removed and the Azure VM deallocated after testing.
Read the completed Azure-to-on-premises Wazuh SSH detection case study.

TA551 / RELATED
Related articles
Cybersecurity
Azure to On-Premises SIEM: SSH Detection with Wazuh and Tailscale
A verified cloud-to-on-premises security monitoring lab: Azure Ubuntu SSH events, Tailscale private connectivity, Wazuh rule 5710, and cost-conscious cleanup.
Cybersecurity
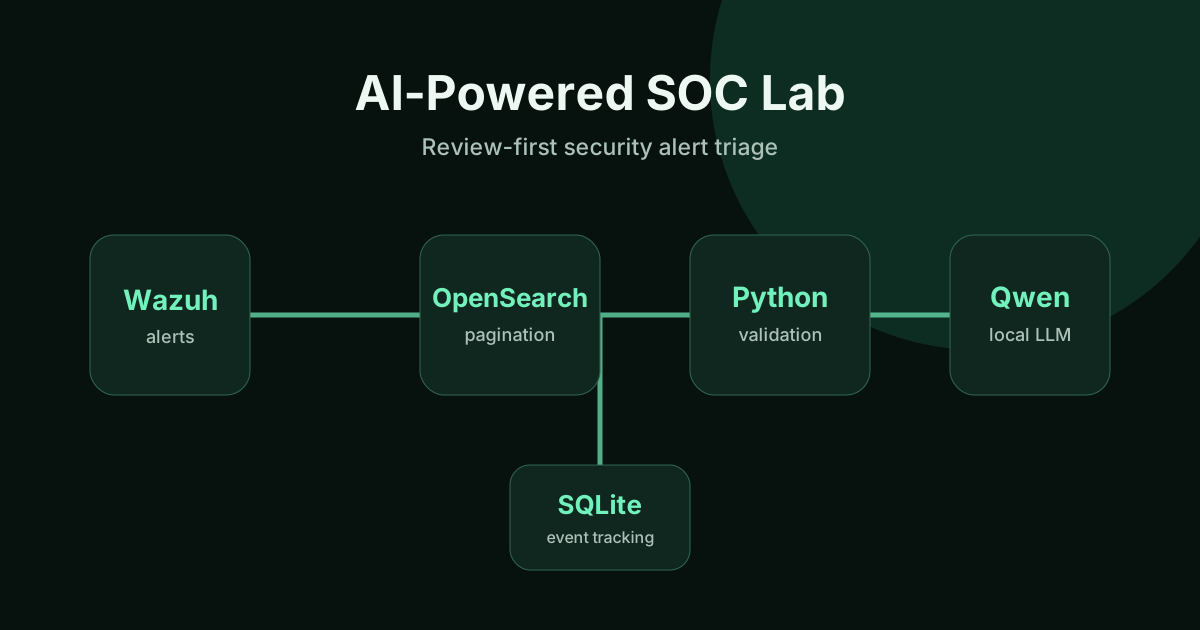
Building a Local AI SOC Lab with Wazuh and Qwen
How I built a review-first Wazuh SIEM lab with OpenSearch, Python, SQLite, and local Qwen AI—and validated pagination, event state, and safe incident triage.
Automation
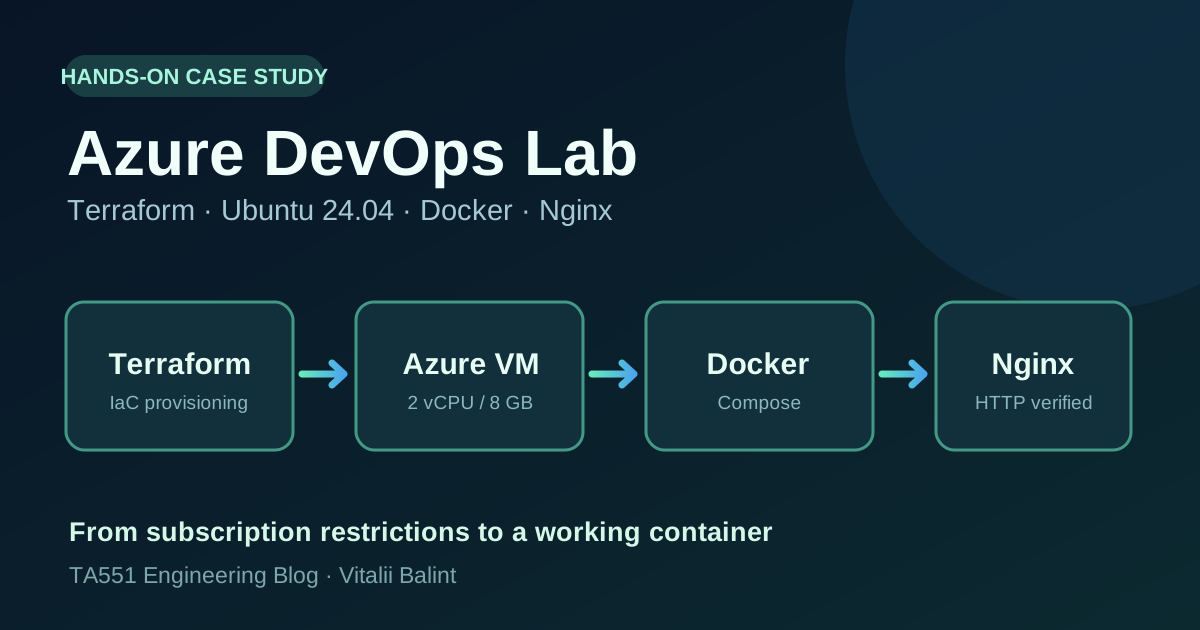
Building an Azure DevOps Lab with Terraform, Ubuntu and Docker
A hands-on Azure case study: provisioning an Ubuntu VM with Terraform, resolving provider registration and VM SKU restrictions, using secure SSH, and verifying an Nginx container with Docker Compose.